Flows stopped showing up in Kibana (Disk(s) Full)
Guidance around storage (Elasticsearch)
Each ElastiFlow record (stored in Elasticsearch) is ~500 bytes (before replication). If your flow rate is 10,000 flows per second, you will ingest around 500bytes*10,000fps = 5,000,000 Bytes/sec or: 3 MB/s, 250 GB/day, 1.7 TB/week, 7.3 TB/month, and 89 TB/yr
With 1 Replica shard, you will want to plan for 900-1000 bytes per record, effectively doubling these numbers. So for seven days of storage (default ElastiFlow ILM delete phase policy) at 10,000 flows per second, you will want at least 2TB of storage without replica shards and 4TB of storage with one replica shard.
Problem
An Elasticsearch cluster has various "watermark" levels. As a node's disk space becomes full, it will first reach the "low disk watermark" threshold, then the "high disk watermark threshold," and finally the "disk flood stage." Once this threshold is exceeded, the cluster will prevent writing to all indices with a shard (primary or replica) on the affected node. However, reading (searching) will still be possible. https://www.elastic.co/guide/en/elasticsearch/reference/master/disk-usage-exceeded.html
Elasticsearch may fail to start and/or crash entirely if a disk becomes full. You should increase the storage on the Elasticsearch node or delete old Indices to get it started again.
Index lifecycle management (ILM) policies should automatically manage indices based on your performance, resiliency, and retention needs. Using ILM, you can:
Create a new index when an existing index reaches a specific size or number of documents
Create a new index on a daily, weekly, or monthly basis and archive previous ones
Automatically delete outdated indices to abide by data retention policies.
https://www.elastic.co/guide/en/elasticsearch/reference/current/index-lifecycle-management.html


Symptoms
Log messages stating "No space left on device."
You no longer see new data inside of the ElastiFlow Dashboards in Kibana.
Elasticsearch/Kibana was initially working fine but has since crashed and won't restart
You cannot query for a list of Indices.


Elasticsearch/Kibana errors:

Stack management -> Index Management is stuck at "Loading Indices..."

Solution - Add storage and use ILM
Elasticsearch ILM can manage your indices, allowing you to delete older indices at a specified time. If configured correctly, this will help avoid the full disk scenarios above. https://www.elastic.co/guide/en/elasticsearch/reference/current/index-lifecycle-management.html
Index Lifecycle Management (ILM) can be used to roll over the indices which store the ElastiFlow™ data, preventing issues that can occur when shards become too large. Enable rollover by setting EF_OUTPUT_ELASTICSEARCH_INDEX_PERIOD to rollover. When enabled, the collector automatically bootstraps the initial index and write alias. https://docs.elastiflow.com/elastic_install_ubuntu/#7-index-lifecycle-management-ilm
The default Index Lifecycle Management (ILM) lifecycle is elastiflow. If this lifecycle doesn't exist, a basic lifecycle will be added, removing data after seven days. This lifecycle can be edited later via Kibana or the Elasticsearch ILM API.
Steps
Enable rollover by setting
EF_OUTPUT_ELASTICSEARCH_INDEX_PERIODtorolloverRun:
systemctl daemon-reload && systemctl restart flowcollVerify the flow collector bootstrapped the index and built the corresponding ILM policy
grep "creating write index" /var/log/elastiflow/flowcoll/flowcoll.log

Stack Management -> Index Lifecycle Management
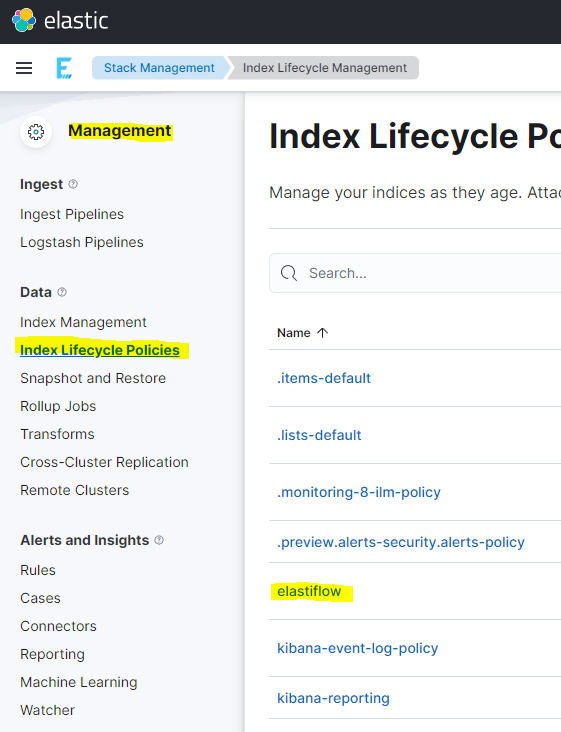
Verify the ILM policy is configured in a way that will not fill the disk past 75%
Solution 2 - Delete old indices
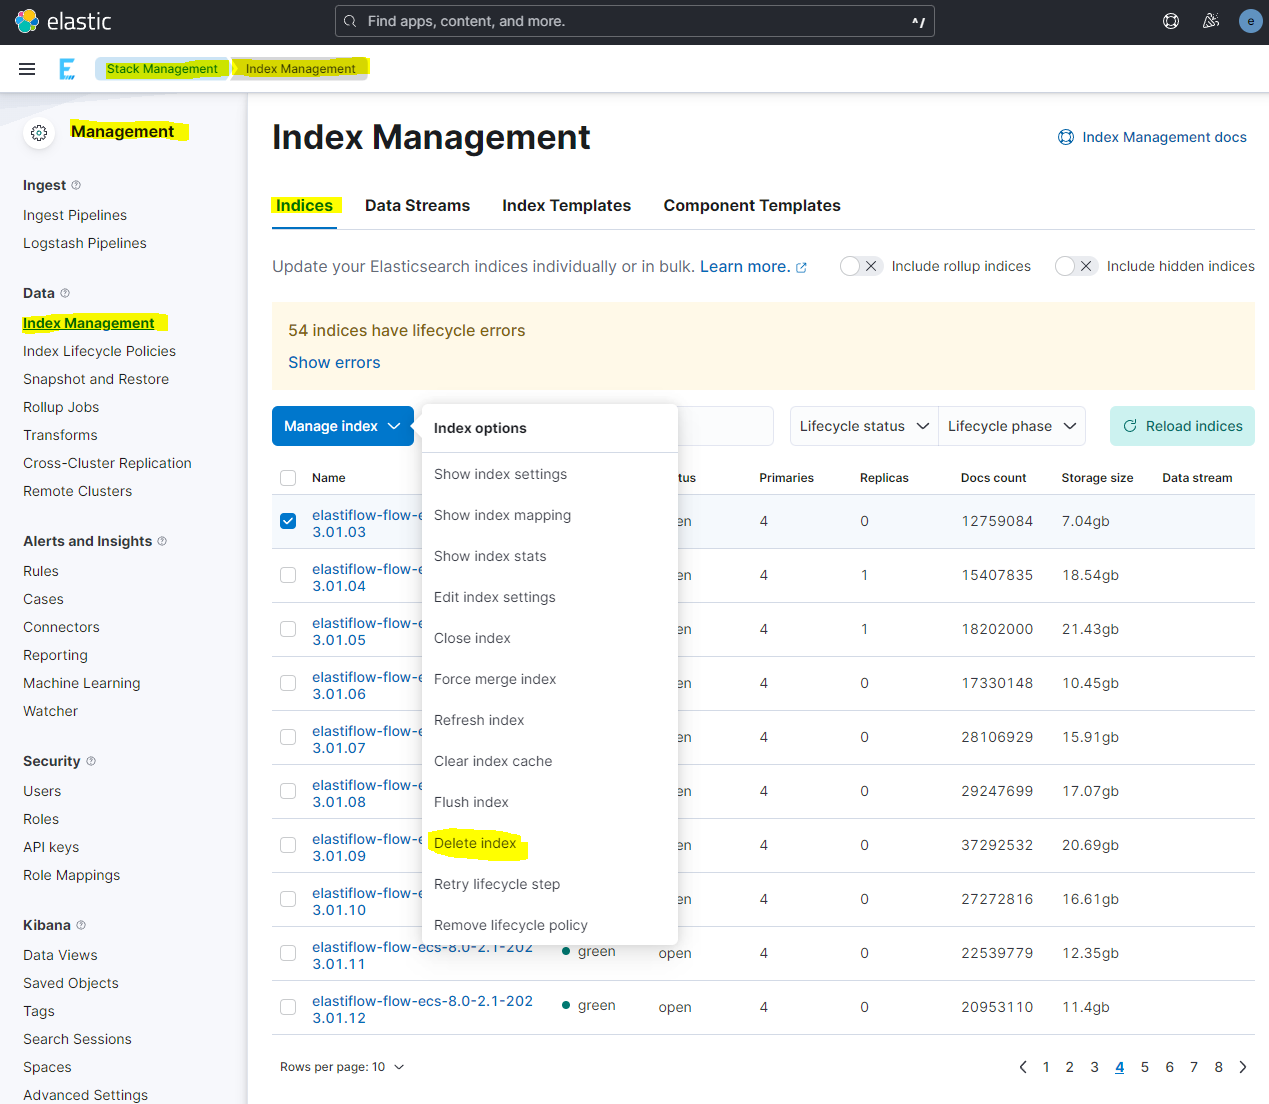
If Kibana is still working, you can go to Stack management and find old indices that can be deleted (WARNING: This will delete all data associated with these indices)
(Note: The warning of 54 errors in the example picture below is because ILM has not been properly set up. Refer to the above on how to set up ILM)
If Kibana is no longer working, but you can still query your Elasticsearch node(s) via the API, you may be able to delete old indices to get things working again. Steps to find and delete older ElastiFlow indices would be as follows:
Query for a list of indices 1a.
curl -XGET https://127.0.0.1:9200/_cat/indices -u elastiflow:elastic --insecure | grep elastiflow-flow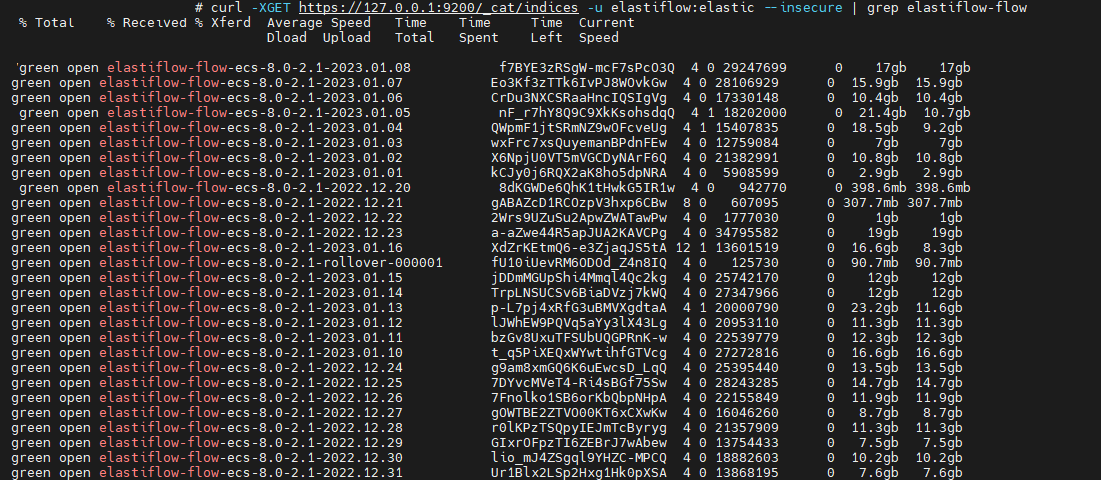
image Select the Index you wish to delete; in this example we will be deleting the oldest index from 2022-12-20
Delete the Index -> 3a.
curl -XDELETE https://127.0.0.1:9200/elastiflow-flow-ecs-8.0-2.1-2022.12.20 -u elastiflow:elastic --insecure
Solution 3 - Remove the read-only index block
read-only index blockIf you've hit a high watermark, Elasticsearch will automatically set "read_only_allow_delete": "true" when hard disk space is low. In this case, Elasticsearch has enforced a read-only index block. You can reset the read-only index block by running the following (Note this will reset the read-only index block on the index named elastiflow-flow-ecs-8.0-2.1-2022.12.20): Run from Dev Tools: PUT /elastiflow-flow-ecs-8.0-2.1-2022.12.20/_settings { "index.blocks.read_only_allow_delete": null }
Curl Example: curl -XPUT -H "Content-Type: application/json" -u elastiflow:elastic --insecure \ https://localhost:9200/_all/_settings \ -d '{"index.blocks.read_only_allow_delete": false}'