Docs
test1test2
6.5
6.5
  • ElastiFlow Documentation
  • Unified Flow Collector
    • General Configuration
    • Changelog
    • Maxmind GeoIP2 and GeoLite2
    • RiskIQ PassiveTotal
    • Network Interfaces
    • User-Defined Metadata
    • Docker
    • Linux
    • Unified Flow Collector Introduction
    • System Requirements
    • Supported IEs
    • AWS VPC Flow Log IEs
    • IPFIX IEs
    • Netflow IEs
    • sFlow IEs
  • Unified SNMP Collector
    • Device Groups
    • Changelog
    • Devices
    • Downloading Definitions
    • Enumerations
    • Objects
    • Object Groups
    • User-Defined Metadata
    • Docker
    • Network Interfaces
    • United SNMP Collector Introduction
    • Linux
    • Scheduling Rediscovery
  • Monitoring ElastiFlow
    • Liveness & Readiness
    • Metrics
    • Prometheus & Grafana
  • Configuration Reference
    • YAML Configuration Files
    • Configuration Reference Overview
    • Common
      • API
      • Licensing
      • Overview
      • Logging
      • HTTP output
      • Elasticsearch output
      • Kafka output
      • Monitor output
      • OpenSearch output
      • Splunk output
      • stdout output
      • Processor
    • Unified Flow Collector
      • Overview
      • Community/Conversation IDs
      • EF_PROCESSOR_ENRICH_TOTALS_IF_NO_DELTAS
      • Overview
      • RiskIQ PassiveTotal
      • Maxmind
      • User-Defined Metadata
      • Overview
      • Overview
      • User-Defined Metadata
      • Overview
      • Benchmark Input
      • Netflow/IPFIX/sFlow (UDP)
      • Licensing
      • Decoder/Processor
      • Sample Rate
      • Configuration Changes
    • Unified SNMP Collector
      • User-Defined Metadata
      • Overview
      • Licensing
      • SNMP Poller
      • EF_PROCESSOR_SNMP_ENUM_DEFINITIONS_DIRECTORY_PATH
  • API Reference
    • API Reference Overview
    • SNMP Operations
  • Data Platforms
    • Elastic
      • Basic Cluster
      • Advanced Cluster
      • Single Server
      • Multi-Tier Cluster
      • Single "Lab" Server
      • Elasticsearch
      • ElastiFlow vs. Filebeat and Logstash
      • RHEL/CentOS
      • Ubuntu/Debian
      • Kibana
      • ML
        • Network Security
        • Machine Learning
        • Availability
          • Network Availability
          • DHCP
          • LDAP
          • DNS
          • NTP
          • RADIUS
          • TCP Sessions
        • Network Security Activity
          • Rare Autonomous System
          • Network Activity
          • Rare Conversation
          • Rare Geolocation
        • Network Security Brute Force
          • Brute Force CLI Access
          • Brute Force Remote Desktop Access
          • Brute Force Attacks
        • Network Security DDoS
          • Denial-of-Service
          • ICMP Flood Attack
          • SYN Flood Attack
          • TCP DDoS Attack
          • UDP Amplification Attack
        • Network Security Recon
          • ICMP Scan
          • Reconnaissance
          • Port Scan
        • Performance
          • Unusual ASN Traffic Volume
          • Unusual Network Interface Traffic Volume
          • Network Performance
    • Opensearch
      • Dashboards
      • Auth Sig V4
    • Splunk
      • Default Search Macro
      • Configuring Data Input & Index
      • Splunk App Installation
    • Output Configuration
  • Additional Guides
    • Catalyst (sFlow)
    • FortiGate
    • hsflowd
    • Configuring Flow Sampling on Juniper Routers
    • Junos OS (sFlow)
    • MikroTik RouterOS
    • OpenWRT (softflowd)
    • Ubiquiti EdgeRouter
    • SonicWall
    • Junos OS
    • Extending SNMP Device Support
    • Flow Device Support Overview
    • SNMP Device Support Overview
    • Generating A Support Bundle
  • FAQ
    • Flows stopped showing up in Kibana (Disk(s) Full)
    • Common reasons why you have discrepancies between ElastiFlow data & reality
    • What Are Snapshots?
    • Importing the wrong dashboards (No data)
  • Knowledge Base
    • Config
      • Elasticsearch Authentication Failure
      • CA Certificate Path Incorrect
      • license/error Invalid Segments
    • Flow
      • Bidirectional Flow Support
      • Configure the UDP Input
      • Flow Records Not Received
      • Netflow v9/IPFIX Template Not Receieved
      • Unsupported sFlow Structures
    • General
      • License Has Expired
      • License Agreement Not Accepted
    • Install
      • .deb Upgrade Fails File Overwrite
    • Operation
      • Flow Collector Queues 90% Full
      • Dashboard Updates
      • Change elastiflow-* Index Name?
  • Elastic Stack Deployment
  • Download Links
Powered by GitBook
On this page
  • Prerequisites
  • ElastiFlow Metrics Endpoint
  • Grafana Installation Guide
  • Prometheus Installation Guide
  • Connect Grafana To Prometheus
  • Import The ElastiFlow Metrics Dashboard
  1. Monitoring ElastiFlow

Prometheus & Grafana

PreviousMetricsNextConfiguration Reference

This page explains how to setup Prometheus and Grafana to monitor the ElastiFlow Unified Collector.

Prerequisites

  1. The ElastiFlow Unified Collector is running and the metrics endpoint is reachable. (Reachable @ http://0.0.0.0:8080/metrics)

  2. Prometheus is installed & running and can reach the Flow Collector Metrics endpoint. (Prometheus default @ http://0.0.0.0:9090)

  3. Grafana is installed & running and can reach Prometheus. (Grafana default @ http://0.0.0.0:3000)

ElastiFlow Metrics Endpoint

  • Verify the ElastiFlow Unified Collector & Metrics Endpoint have successfully started (logs in /var/log/elastiflow/flowcoll/flowcoll.log):

2022-10-21T08:31:23.078-0700  info  pipeline/appserver.go:44  metrics exposed at http://0.0.0.0:8080/metrics

:::tip If another service is already using port 8080, you can change the port on which the collector listens by setting EF_API_PORT. :::

Grafana Installation Guide

  • OS specific Grafana installation guides:

  • Debian/Ubuntu installation guide:

  • RPM-based installation guide:

Prometheus Installation Guide

  • Main Installation guides:

  • Precompiled binaries:

Prometheus Configuration

  1. Once Prometheus is installed edit prometheus.yml and add a job pointing to the ElastiFlow Unified Collector as in the following example:

Example default Prometheus configuration:

# my global config
global:
  scrape_interval: 15s # Set the scrape interval to every 15 seconds. Default is every 1 minute.
  evaluation_interval: 15s # Evaluate rules every 15 seconds. The default is every 1 minute.
  # scrape_timeout is set to the global default (10s).

# Alertmanager configuration
alerting:
  alertmanagers:
    - static_configs:
        - targets:
          # - alertmanager:9093

# Load rules once and periodically evaluate them according to the global 'evaluation_interval'.
rule_files:
  # - "first_rules.yml"
  # - "second_rules.yml"

# A scrape configuration containing exactly one endpoint to scrape:
# Here it's Prometheus itself.
scrape_configs:
  # The job name is added as a label `job=<job_name>` to any time series scraped from this config.
  - job_name: "prometheus"

    # metrics_path defaults to '/metrics'
    # scheme defaults to 'http'.

    static_configs:
      - targets: ["localhost:9090"]

An ElastiFlow-specific Job:

    job_name: elastiflow-metrics-1
    scrape_interval: 15s
    metrics_path: /metrics

    scheme: http
    static_configs:
      - targets: ['192.168.3.18:8080']

Connect Grafana To Prometheus

Import The ElastiFlow Metrics Dashboard

  1. Import the Dashboard by entering the dashboard ID (17306) found after searching ElastiFlow Metrics in the Grafana Labs Dashboards search by going to Dashboards -> Import and clicking "Load":

Once Grafana is up and running; from the "Welcome To Grafana" page click the cogwheel in the bottom left corner, then click "Data Sources", and finally click "Add Data Source":

Select Prometheus
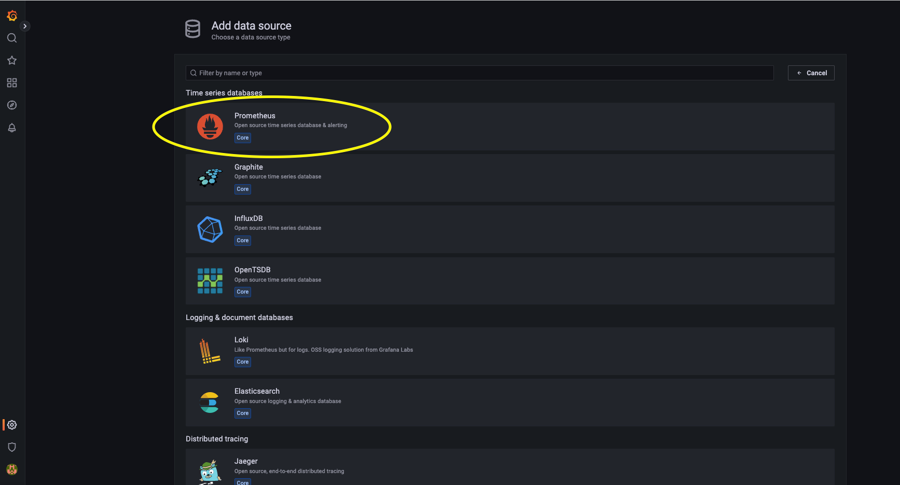
Name this Prometheus Datasource, type your Prometheus endpoint IP address and port in the "URL" field, and configure the authentication and "scrape interval" you have set up: Click "Save & Test"

The ElastiFlow Metrics Dashboard can be found by searching Grafana Labs Dashboards:

Direct Link:

Image
Image

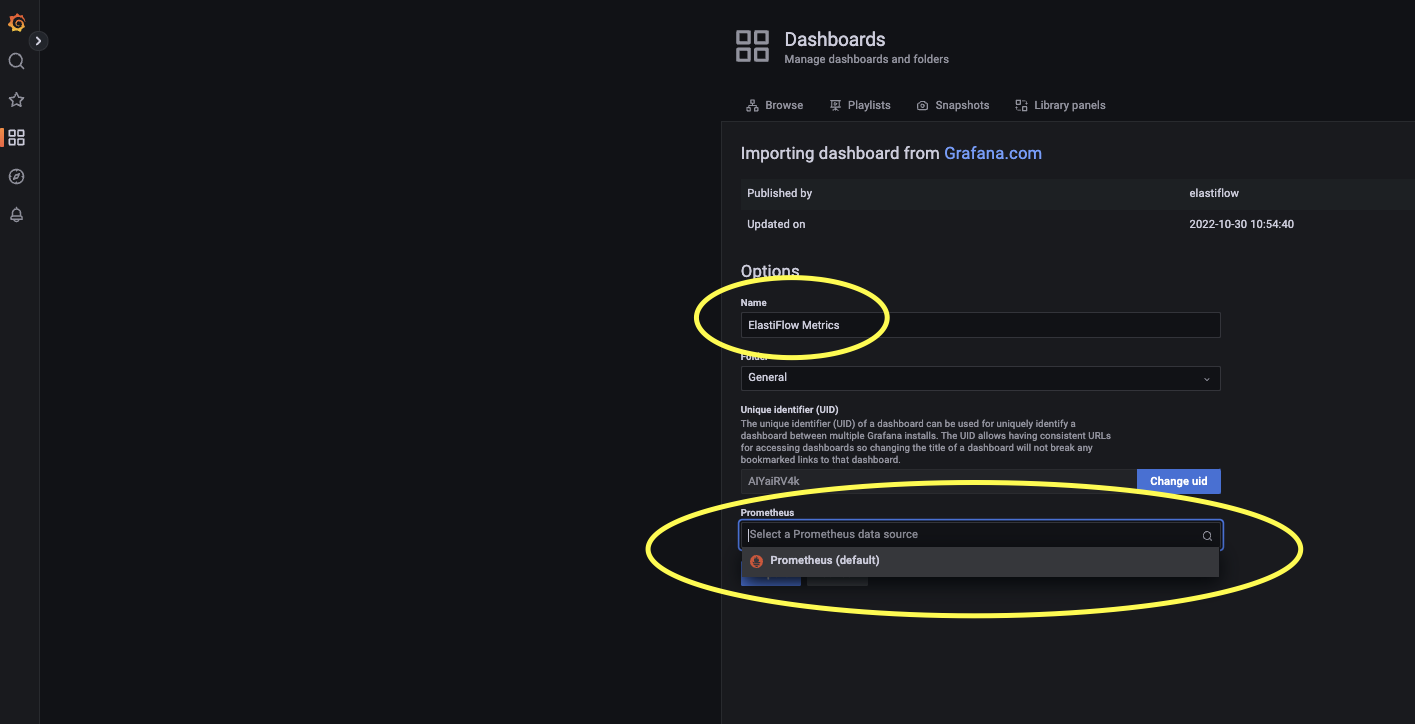
2. Accept the default or give the dashboard a name and place it in the folder you'd like it to reside in. After this point to the Prometheus Datasource you previously connected above click "Import" and you are done.
Image
https://grafana.com/docs/grafana/latest/setup-grafana/installation/
https://grafana.com/docs/grafana/latest/setup-grafana/installation/debian/
https://grafana.com/docs/grafana/latest/setup-grafana/installation/rpm/
https://prometheus.io/docs/prometheus/latest/installation/
https://prometheus.io/download/
https://grafana.com/grafana/dashboards/
https://grafana.com/grafana/dashboards/17306-elastiflow-metrics/