Prometheus & Grafana
This page explains how to setup Prometheus and Grafana to monitor the ElastiFlow Unified Collector.
Prerequisites
The ElastiFlow Unified Collector is running and the metrics endpoint is reachable. (Reachable @ http://0.0.0.0:8080/metrics)
Prometheus is installed & running and can reach the Flow Collector Metrics endpoint. (Prometheus default @ http://0.0.0.0:9090)
Grafana is installed & running and can reach Prometheus. (Grafana default @ http://0.0.0.0:3000)
ElastiFlow Metrics Endpoint
Verify the ElastiFlow Unified Collector & Metrics Endpoint have successfully started (logs in /var/log/elastiflow/flowcoll/flowcoll.log):
:::tip If another service is already using port 8080
, you can change the port on which the collector listens by setting EF_API_PORT
. :::
Grafana Installation Guide
OS specific Grafana installation guides: https://grafana.com/docs/grafana/latest/setup-grafana/installation/
Debian/Ubuntu installation guide: https://grafana.com/docs/grafana/latest/setup-grafana/installation/debian/
RPM-based installation guide: https://grafana.com/docs/grafana/latest/setup-grafana/installation/rpm/
Prometheus Installation Guide
Main Installation guides: https://prometheus.io/docs/prometheus/latest/installation/
Precompiled binaries: https://prometheus.io/download/
Prometheus Configuration
Once Prometheus is installed edit
prometheus.yml
and add a job pointing to the ElastiFlow Unified Collector as in the following example:
Example default Prometheus configuration:
An ElastiFlow-specific Job:
Connect Grafana To Prometheus
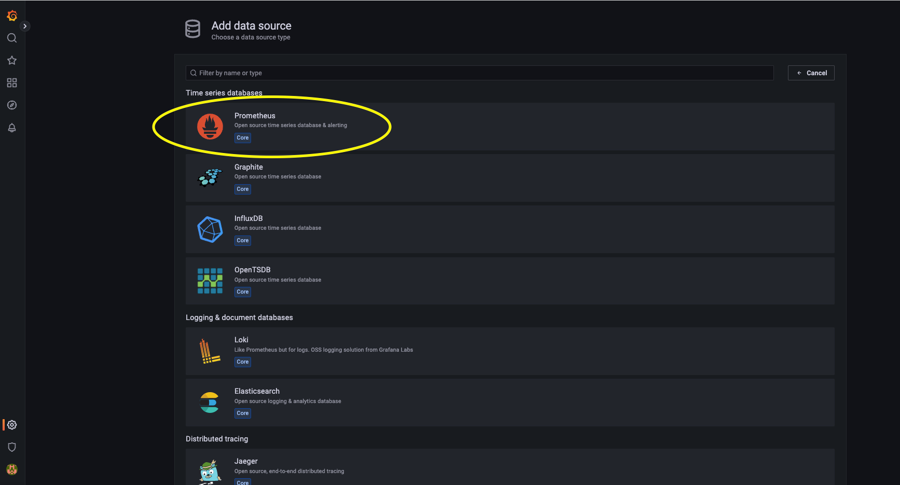
Once Grafana is up and running; from the "Welcome To Grafana" page click the cogwheel in the bottom left corner, then click "Data Sources", and finally click "Add Data Source":
Select Prometheus
Name this Prometheus Datasource, type your Prometheus endpoint IP address and port in the "URL" field, and configure the authentication and "scrape interval" you have set up:
Click "Save & Test"
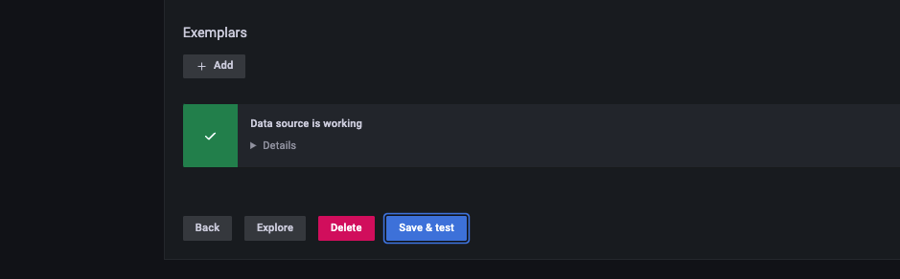
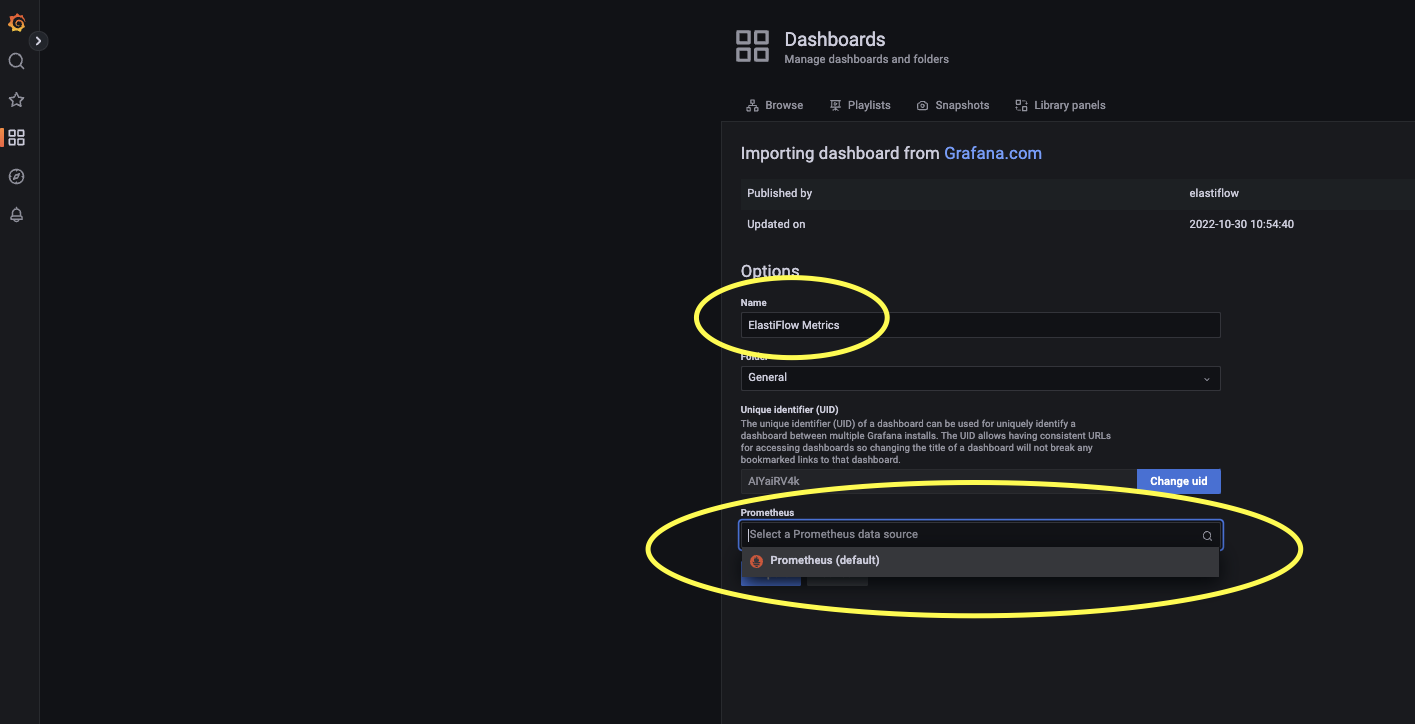
Import The ElastiFlow Metrics Dashboard
The ElastiFlow Metrics Dashboard can be found by searching Grafana Labs Dashboards: https://grafana.com/grafana/dashboards/
Direct Link: https://grafana.com/grafana/dashboards/17306-elastiflow-metrics/


Import the Dashboard by entering the dashboard ID (17306) found after searching ElastiFlow Metrics in the Grafana Labs Dashboards search by going to Dashboards -> Import and clicking "Load":
2. Accept the default or give the dashboard a name and place it in the folder you'd like it to reside in. After this point to the Prometheus Datasource you previously connected above click "Import" and you are done.
