Common reasons why you have discrepancies between ElastiFlow data & reality
Problem
When visualizing ElastiFlow data, it is much higher or lower than expected.
Reason #1: Sample Rate
A sample rate is the average ratio of packets incoming on a sFlow-enabled port to the number of flow samples taken from those packets. sFlow sampling can affect performance on some network equipment. https://blog.sflow.com/2009/06/sampling-rates.html
How sample rates impact ElastiFlow data accuracy
The collector must adjust the calculation of bytes and packets based on the sampling rate used. Usually, devices will inform the collector of the sampling rate either within the flow record itself or as option data sent periodically by the device. This setting specifies the size of the cache to be used to hold sample rate information learned from option data.
Reference: https://docs.elastiflow.com/config_ref_sampling/#sample-rate
What is a "good" sampling rate?: https://blog.sflow.com/2009/05/scalability-and-accuracy-of-packet.html
Detailed Explanation: https://sflow.org/packetSamplingBasics/index.htm
Confirming a devices sample rate
If you go to:
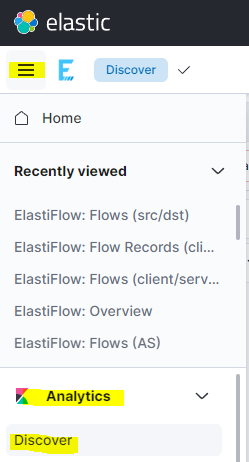
After filtering on the exporter in question
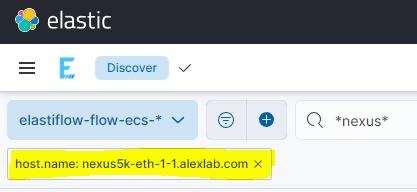
You can look at a record and focus on the following field to see what the flow collector thinks the current sample rate is:

In the above example you can see the flow collector believes the sample rate is 1:1; however, as you can see below the device is configured with a sample rate of 1:512 thus the discrepancy in packets and bytes:

This is because the sampler table is not configured to be sent by the flow exporter (In this example a Cisco Nexus switch). On some flow exporters you must specify a 'sample options template' to be sent, in this case Cisco refers to this as a 'sampler-table'. Configuring the network device to send this is as easy as adding it to the flow configuration on the flow exporter (a Cisco Nexus switch in this example):

Now (after the timeout period has elapsed and the flow exporter sends the sampler table), when we go back into Kibana & check the flow.meter.packet_select.interval.packets field values in flow records coming from the Nexus switch, we can see the flow collector knows about the correct sample rate of 1:512:

Reason #2: Your flow exporter is counting the same flow(s) multiple times
When configuring Flow exporters (routers, switches, firewalls, etc...) It is typical to configure flow collection on specific interface(s). If misconfigured, this can lead to flows being counted two or more times and then added together.
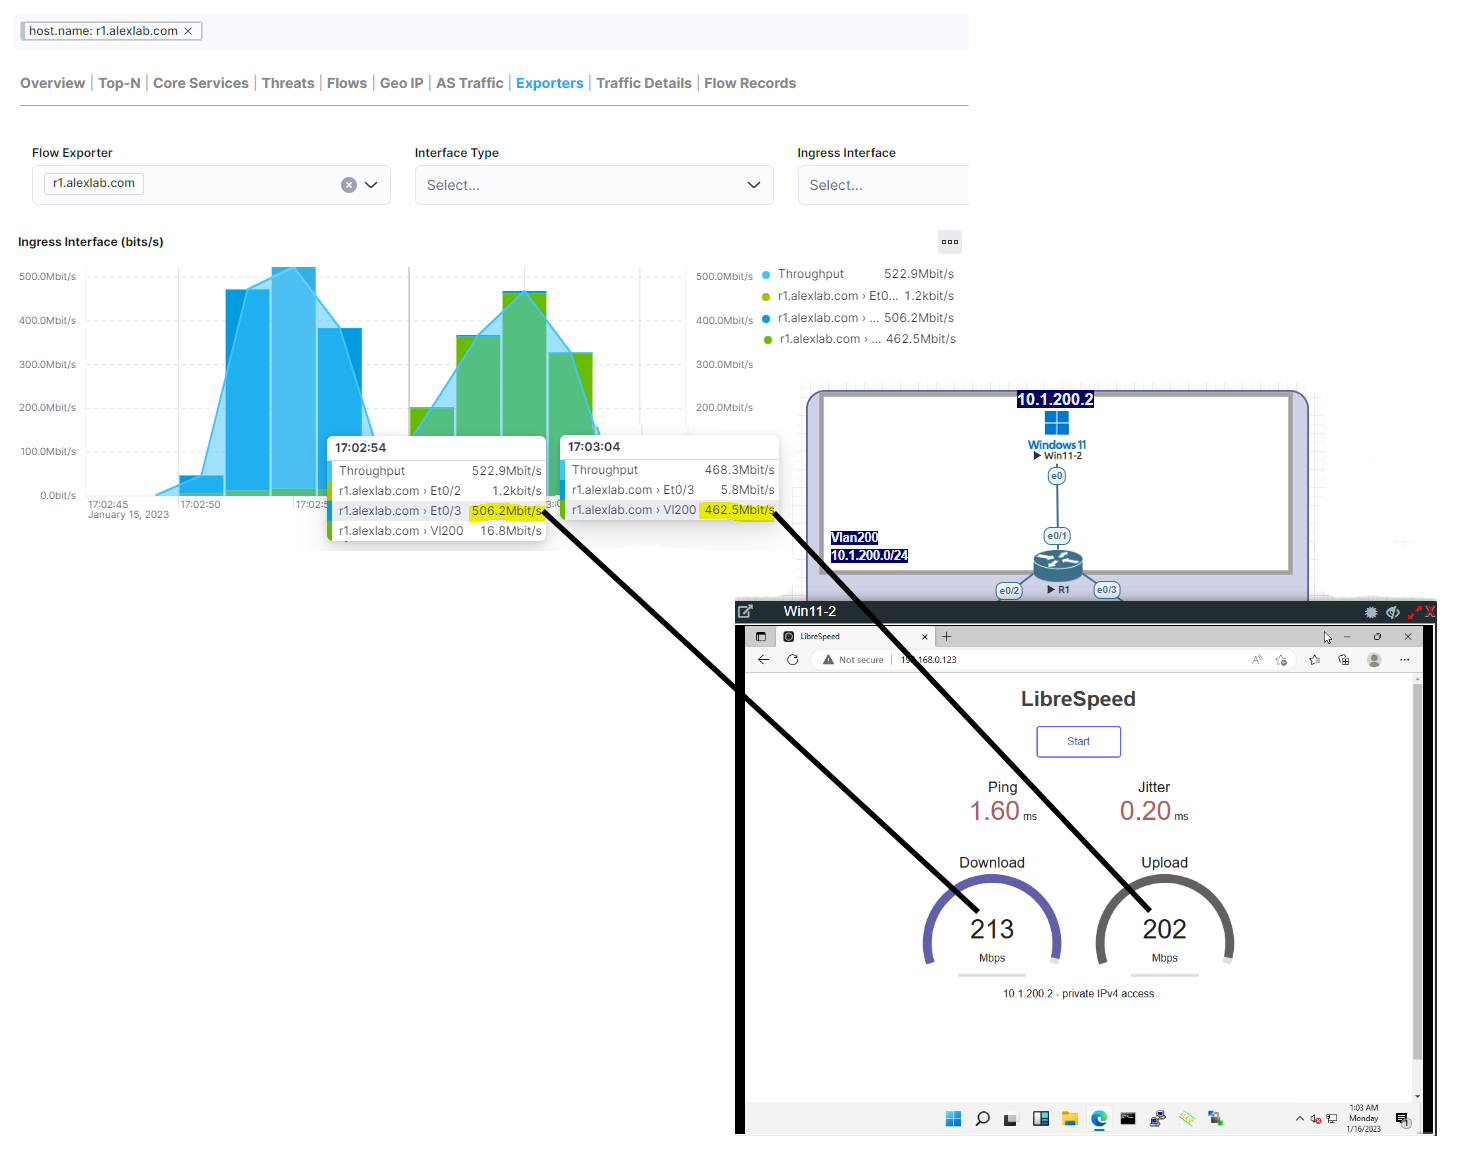
Example of a flow exporter counting a single flow multiple times

Why this happens (configuration of R1)
As you can see below, not only is R1 configured to collect flows from Ethernet 0/3, Ethernet 0/2, and Vlan200, It is collecting flows from these interfaces in both the input and output directions.
In the example speed test above, flows are counted twice and achieve a download speed of ~213mbps. The flow is counted as it enters interface ethernet 0/3 and as it comes out of vlan 200 toward the destination Win11-2 computer. In both cases, the ingress interface is Ethernet 0/3, and the egress interface is Vlan200; thus, counting a single flow two times resulted in the above-measured throughput of 506.2Mbps when in reality, it was only ~213mbps.
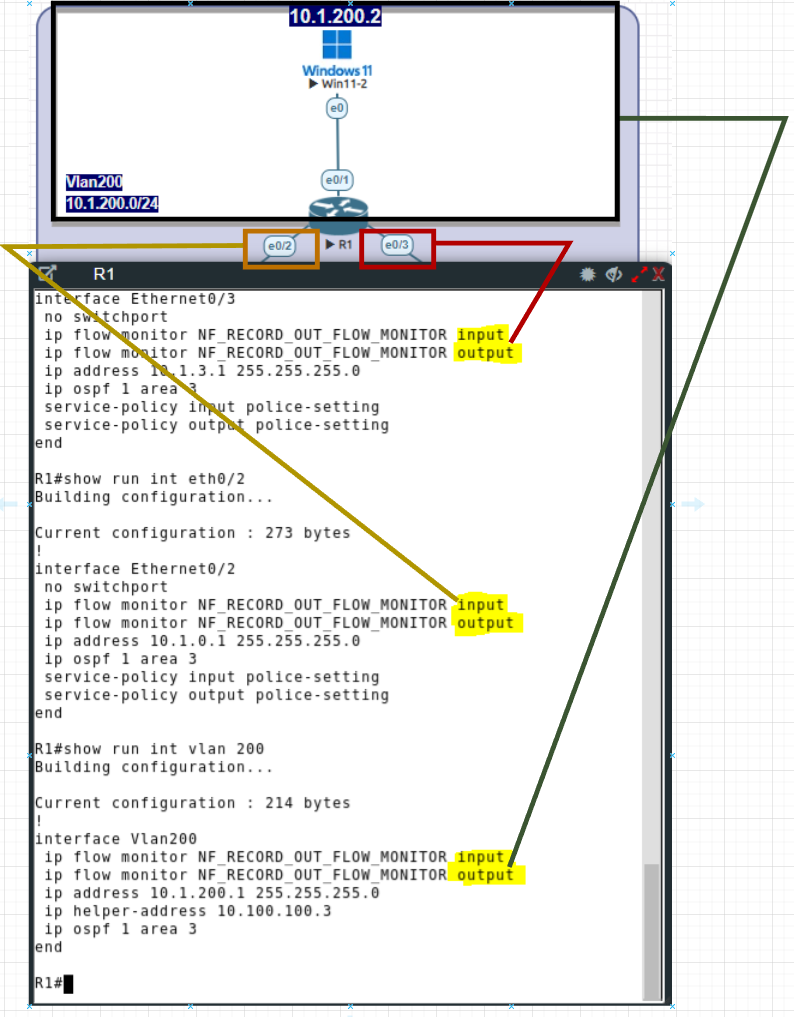
We will only apply the monitor in the input direction on all these interfaces to correct this and remove the output configuration.
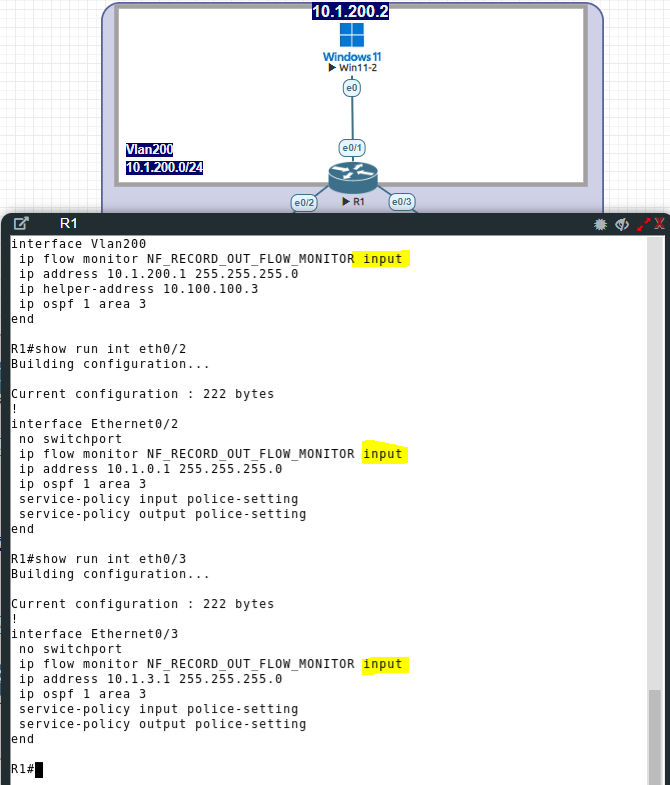
Now when we run another speed test, we see the correct throughput:
